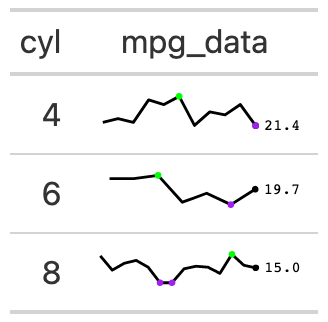
The gt_sparkline function takes an existing gt_tbl object and
adds sparklines via the ggplot2. This is a wrapper around
gt::text_transform() + ggplot2 with the necessary boilerplate already applied.
Usage
gt_sparkline(
  gt_object,
  column,
  type = "sparkline",
  width = 30,
  line_color = "black",
  range_colors = c("red", "blue"),
  fill_color = "grey",
  bw = NULL,
  trim = FALSE,
  same_limit = TRUE,
  label = TRUE
)
Arguments
- gt_object
An existing gt table object of class
gt_tbl- column
The column wherein the sparkline plot should replace existing data. Note that the data must be represented as a list of numeric values ahead of time.
- type
A string indicating the type of plot to generate, accepts
"sparkline","histogram"or"density".- width
A number indicating the width of the plot in mm at a DPI of 25.4, defaults to 30
- line_color
Color for the line, defaults to
"black". Accepts a named color (eg 'blue') or a hex color.- range_colors
A vector of two valid color names or hex codes, the first color represents the min values and the second color represents the highest point per plot. Defaults to
c("blue", "blue"). Accepts a named color (eg'blue') or a hex color like"#fafafa".- fill_color
Color for the fill of histograms/density plots, defaults to
"grey". Accepts a named color (eg'blue') or a hex color.- bw
The bandwidth or binwidth, passed to
density()orggplot2::geom_histogram(). Iftype = "density", thenbwis passed to thebwargument, iftype = "histogram", thenbwis passed to thebinwidthargument.- trim
A logical indicating whether to trim the values in
type = "density"to a slight expansion beyond the observable range. Can help with long tails indensityplots.- same_limit
A logical indicating that the plots will use the same axis range (
TRUE) or have individual axis ranges (FALSE).- label
A logical indicating whether the sparkline will have a numeric label at the end of the plot.
See also
Other Plotting:
gt_plt_bar_pct(),
gt_plt_bar_stack(),
gt_plt_bar(),
gt_plt_dist(),
gt_plt_percentile(),
gt_plt_point(),
gt_plt_sparkline(),
gt_plt_winloss()