Add a percent stacked barchart in place of existing data.
Source:R/gt_pct_bar.R
gt_plt_bar_stack.RdThe gt_plt_bar_stack function takes an existing gt_tbl object and
converts the existing values into a percent stacked barchart. The bar chart
will represent either 2 or 3 user-specified values per row, and requires
a list column ahead of time. The palette and labels need to be equal length.
The values must either add up to 100 ie as percentage points if using
position = 'fill', or can be raw values with position = 'stack'. Note that
the labels can be controlled via the fmt_fn argument and the
scales::label_???() family of function.
Usage
gt_plt_bar_stack(
  gt_object,
  column = NULL,
  palette = c("#ff4343", "#bfbfbf", "#0a1c2b"),
  labels = c("Group 1", "Group 2", "Group 3"),
  position = "fill",
  width = 70,
  fmt_fn = scales::label_number(scale_cut = cut_short_scale(), trim = TRUE),
  font = "mono"
)
Arguments
- gt_object
An existing gt table object of class
gt_tbl- column
The column wherein the percent stacked barchart should replace existing data. Note that the data must be represented as a list of numeric values ahead of time.
- palette
A color palette of length 2 or 3, represented either by hex colors (
"#ff4343") or named colors ("red").- labels
A vector of strings of length 2 or 3, representing the labels for the bar chart, will be colored according to the palette as well.
- position
An string indicator passed to
ggplot2indicating if the bar should be a percent of total"fill"or stacked as the raw values"stack".- width
An integer representing the width of the bar chart in pixels.
- fmt_fn
A specific function from
scales::label_???family. Defaults toscales::label_number()- font
A string representing the font family of the numbers of the bar labels. Defaults to
mono.
Examples
library(gt)
library(dplyr)

ex_df <- dplyr::tibble(
  x = c("Example 1","Example 1",
        "Example 1","Example 2","Example 2","Example 2",
        "Example 3","Example 3","Example 3","Example 4","Example 4",
        "Example 4"),
  measure = c("Measure 1","Measure 2",
              "Measure 3","Measure 1","Measure 2","Measure 3",
              "Measure 1","Measure 2","Measure 3","Measure 1","Measure 2",
              "Measure 3"),
  data = c(30, 20, 50, 30, 30, 40, 30, 40, 30, 30, 50, 20)
)


tab_df <- ex_df %>%
  group_by(x) %>%
  summarise(list_data = list(data))

tab_df

ex_tab <- tab_df %>%
  gt() %>%
  gt_plt_bar_stack(column = list_data)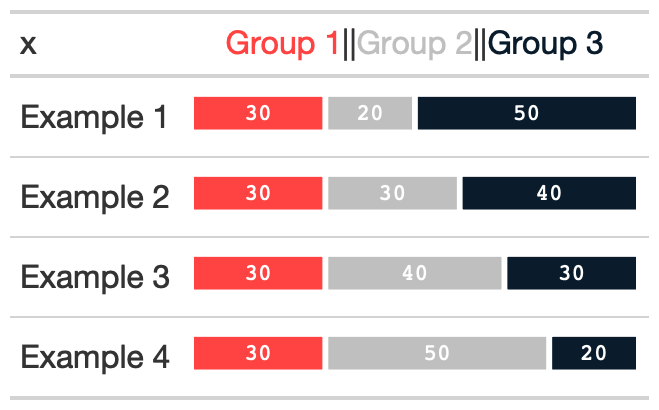
See also
Other Plotting:
gt_plt_bar(),
gt_plt_bar_pct(),
gt_plt_dist(),
gt_plt_percentile(),
gt_plt_point(),
gt_plt_sparkline(),
gt_plt_winloss()