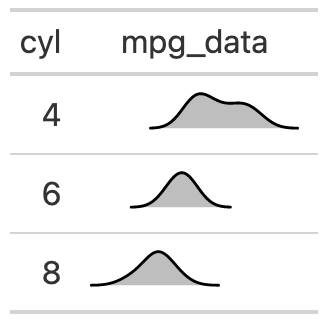
The gt_plt_dist function takes an existing gt_tbl object and
adds summary distribution sparklines via ggplot2. Note that these sparklines
are limited to density, histogram, boxplot or rug/strip charts. If you're
wanting to plot more traditional sparklines, you can use gtExtras::gt_plt_sparkline().
Usage
gt_plt_dist(
  gt_object,
  column,
  type = "density",
  fig_dim = c(5, 30),
  line_color = "black",
  fill_color = "grey",
  bw = NULL,
  trim = FALSE,
  same_limit = TRUE,
  type_col = NULL
)
Arguments
- gt_object
An existing gt table object of class
gt_tbl- column
The column wherein the sparkline plot should replace existing data. Note that the data must be represented as a list of numeric values ahead of time.
- type
A string indicating the type of plot to generate, accepts
"boxplot","histogram","rug_strip"or"density".- fig_dim
A vector of two numbers indicating the height/width of the plot in mm at a DPI of 25.4, defaults to
c(5,30)- line_color
Color for the line, defaults to
"black". Accepts a named color (eg 'blue') or a hex color.- fill_color
Color for the fill of histograms/density plots, defaults to
"grey". Accepts a named color (eg'blue') or a hex color.- bw
The bandwidth or binwidth, passed to
density()orggplot2::geom_histogram(). Iftype = "density", thenbwis passed to thebwargument, iftype = "histogram", thenbwis passed to thebinwidthargument.- trim
A logical indicating whether to trim the values in
type = "density"to a slight expansion beyond the observable range. Can help with long tails indensityplots.- same_limit
A logical indicating that the plots will use the same axis range (
TRUE) or have individual axis ranges (FALSE).- type_col
A tidyselect column indicating a vector of which
typeof plot to make by row. Must be equal to the total number of rows and limited to"boxplot","histogram","rug_strip"or"density".