The gt_plt_winloss function takes an existing gt_tbl object and
adds squares of a specific color and vertical position based on wins/losses.
It is a wrapper around gt::text_transform(). The column chosen must be
a list-column as seen in the example code. The column should also only contain
values of 0 (loss), 0.5 (tie), and 1 (win).
Usage
gt_plt_winloss(
  gt_object,
  column,
  max_wins = 17,
  palette = c("#013369", "#D50A0A", "gray"),
  type = "pill",
  width = max_wins/0.83
)
Arguments
- gt_object
An existing gt table object of class
gt_tbl- column
The column wherein the winloss plot should replace existing data. Note that the data must be represented as a list of numeric values ahead of time.
- max_wins
An integer indicating the max possible wins, this will be used to add padding if the total wins/losses observed is less than the max. This is useful for mid-season reporting. Defaults to a red, blue, grey palette.
- palette
A character vector of length 3, specifying the colors for win, loss, tie in that exact order.
- type
A character string representing the type of plot, either a 'pill' or 'square'
- width
A numeric indicating the width of the plot in
mm, this can help with larger datasets where data points are overlapping.
Examples
#' library(gt)

set.seed(37)
data_in <- dplyr::tibble(
  grp = rep(c("A", "B", "C"), each = 10),
  wins = sample(c(0,1,.5), size = 30, prob = c(0.45, 0.45, 0.1), replace = TRUE)
) %>%
  dplyr::group_by(grp) %>%
  dplyr::summarize(wins=list(wins), .groups = "drop")

data_in

win_table <- data_in %>%
  gt() %>%
  gt_plt_winloss(wins)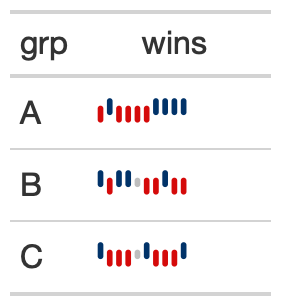
See also
Other Plotting:
gt_plt_bar(),
gt_plt_bar_pct(),
gt_plt_bar_stack(),
gt_plt_dist(),
gt_plt_percentile(),
gt_plt_point(),
gt_plt_sparkline()