The gt_highlight_rows function takes an existing gt_tbl object and
adds highlighting color to the cell background of a specific row. The function
accepts rows only by number (not by logical expression) for now.
Usage
gt_highlight_rows(
  gt_object,
  columns = gt::everything(),
  rows = TRUE,
  fill = "#80bcd8",
  alpha = 0.8,
  font_weight = "bold",
  font_color = "#000000",
  bold_target_only = FALSE,
  target_col = c()
)
Arguments
- gt_object
An existing gt table object of class
gt_tbl- columns
Specific columns to apply color to, accepts either
tidyevalcolum names or columns by position.- rows
The rows to apply the highlight to. Can either by a
tidyevalcompliant statement (likecyl == 4), a number indicating specific row(s) to apply color to orTRUEto indicate all rows.- fill
A character string indicating the fill color. If nothing is provided, then "#80bcd8" (light blue) will be used as a default.
- alpha
An optional alpha transparency value for the color as single value in the range of 0 (fully transparent) to 1 (fully opaque). If not provided the fill color will either be fully opaque or use alpha information from the color value if it is supplied in the #RRGGBBAA format.
- font_weight
A string or number indicating the weight of the font. Can be a text-based keyword such as "normal", "bold", "lighter", "bolder", or, a numeric value between 1 and 1000, inclusive. Note that only variable fonts may support the numeric mapping of weight.
- font_color
A character string indicating the text color. If nothing is provided, then "#000000" (black) will be used as a default.
- bold_target_only
A logical of TRUE/FALSE indicating whether to apply bold to only the specific
target_col. You must indicate a specific column withtarget_col.- target_col
A specific
tidyevalcolumn to apply bold text to, which allows for normal weight text for the remaining highlighted columns.
Examples
library(gt)
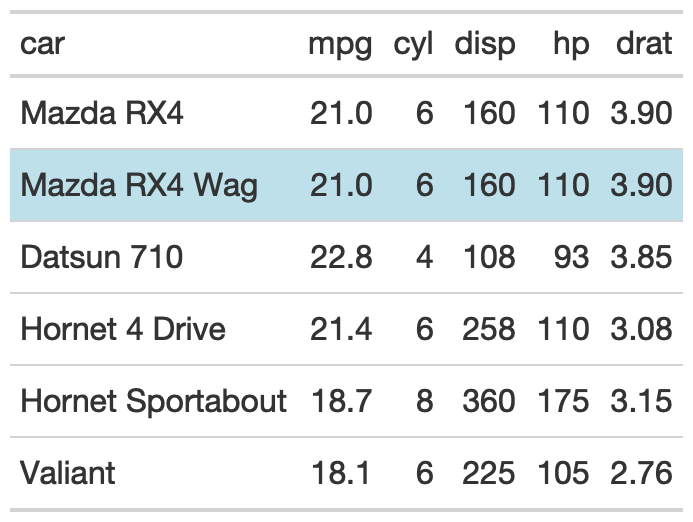
basic_use <- head(mtcars[,1:5]) %>%
tibble::rownames_to_column("car") %>%
gt() %>%
gt_highlight_rows(rows = 2, font_weight = "normal")
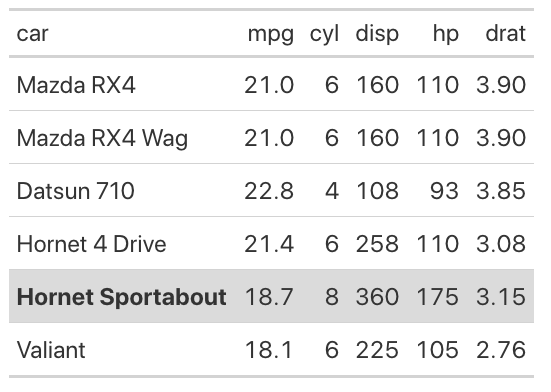
target_bold_column <- head(mtcars[,1:5]) %>%
tibble::rownames_to_column("car") %>%
gt() %>%
gt_highlight_rows(
rows = 5,
fill = "lightgrey",
bold_target_only = TRUE,
target_col = car
)
See also
Other Utilities:
add_text_img(),
fa_icon_repeat(),
fmt_pad_num(),
fmt_pct_extra(),
fmt_symbol_first(),
generate_df(),
gt_add_divider(),
gt_badge(),
gt_double_table(),
gt_duplicate_column(),
gt_fa_rank_change(),
gt_fa_rating(),
gt_highlight_cols(),
gt_img_border(),
gt_img_circle(),
gt_img_multi_rows(),
gt_img_rows(),
gt_index(),
gt_merge_stack(),
gt_merge_stack_color(),
gt_two_column_layout(),
gtsave_extra(),
img_header(),
pad_fn(),
tab_style_by_grp()