Plot a confidence interval around a point
Arguments
- gt_object
An existing gt table
- column
The column that contains the mean of the sample. This can either be a single number per row, if you have calculated the values ahead of time, or a list of values if you want to calculate the confidence intervals.
- ci_columns
Optional columns representing the left/right confidence intervals of your sample.
- ci
The confidence interval, representing the percentage, ie
0.9which represents10-90for the two tails.- ref_line
A number indicating where to place reference line on x-axis.
- palette
A vector of color strings of exactly length 4. The colors represent the central point, the color of the range, the color of the stroke around the central point, and the color of the text, in that specific order.
- width
A number indicating the width of the plot in
"mm", defaults to45.- text_args
A list of named arguments. Optional text arguments passed as a list to
scales::label_number.- text_size
A number indicating the size of the text indicators in the plot. Defaults to 1.5. Can also be set to
0to "remove" the text itself.
Examples
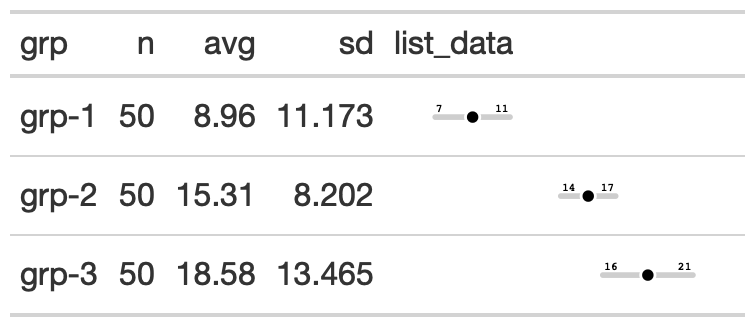
# gtExtras can calculate basic conf int
# using confint() function
ci_table <- generate_df(
n = 50, n_grps = 3,
mean = c(10, 15, 20), sd = c(10, 10, 10),
with_seed = 37
) %>%
dplyr::group_by(grp) %>%
dplyr::summarise(
n = dplyr::n(),
avg = mean(values),
sd = sd(values),
list_data = list(values)
) %>%
gt::gt() %>%
gt_plt_conf_int(list_data, ci = 0.9)
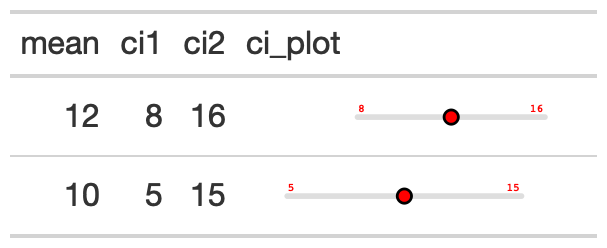
# You can also provide your own values
# based on your own algorithm/calculations
pre_calc_ci_tab <- dplyr::tibble(
mean = c(12, 10), ci1 = c(8, 5), ci2 = c(16, 15),
ci_plot = c(12, 10)
) %>%
gt::gt() %>%
gt_plt_conf_int(
ci_plot, c(ci1, ci2),
palette = c("red", "lightgrey", "black", "red")
)