03 - Code and Editors
Code
Execute code
One of the biggest similarities AND differences between Quarto and RMarkdown is how it handles native code.
Quarto uses the {knitr} engine just like RMarkdown to execute R code natively, along with many other languages.
Quarto can also use the Jupyter engine to natively execute Julia, Python, or other languages that Jupyter supports.

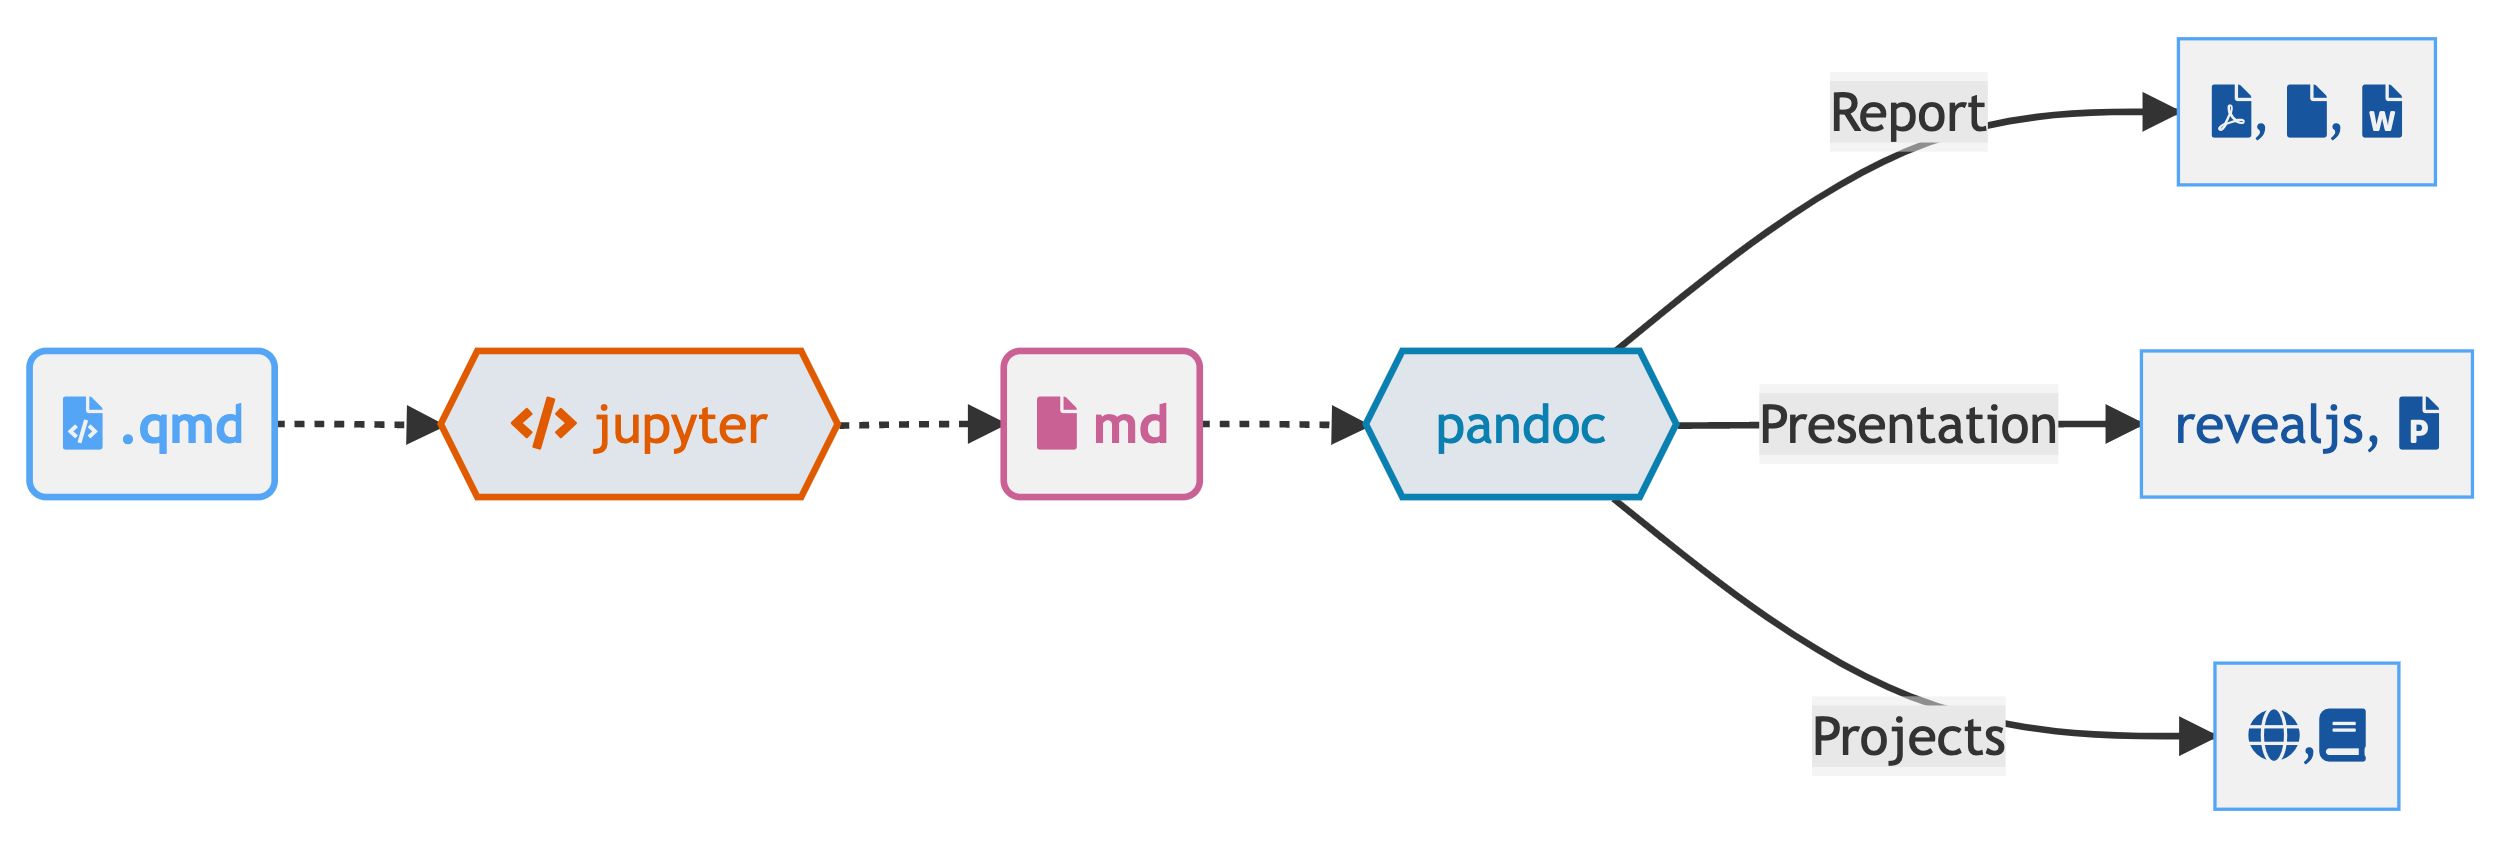
Choose your engine
You can specify Jupyter to use defaults
Or a specific Python version
Or even a specific Jupyter Kernel!
Start your engine!

knitr code cells
There’s a lot of knitr options!
Anatomy of a code chunk
Code

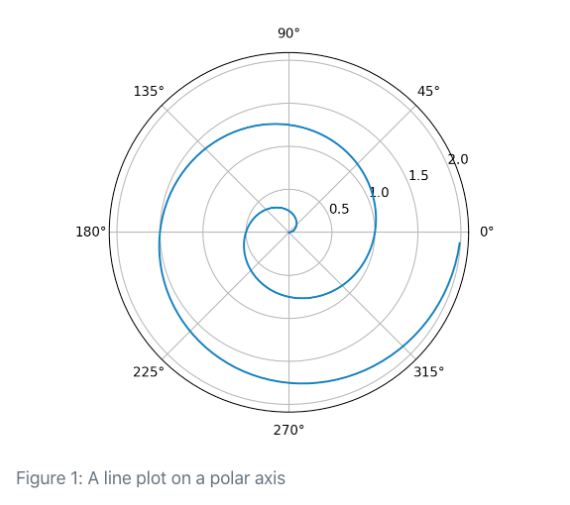
Code, more than just R
```{python}
#| label: fig-polar
#| eval: false
#| fig-cap: "A line plot on a polar axis"

import numpy as np
import matplotlib.pyplot as plt

r = np.arange(0, 2, 0.01)
theta = 2 * np.pi * r
fig, ax = plt.subplots(
  subplot_kw = {'projection': 'polar'}
)
ax.plot(theta, r)
ax.set_rticks([0.5, 1, 1.5, 2])
ax.grid(True)
plt.show()
```
Create code chunks
- You can manually type out code chunks:
```{r} - the keyboard shortcut
Ctrl + Alt + I(OS X:Cmd + Option + I) - the Add Chunk command in the editor toolbar
Or use the Command Palette: Cmd + Shift + P/Ctrl + Shift + P
Our turn
- Open
materials/workshop/03-computation/penguin-analysis.qmd - Insert three total code chunks with the shortcut
Ctrl + Alt + I- Chunk 1: load
tidyverseandpalmerpenguinsR packages and print thepenguinsdataset withglimpse() - Chunk 3: Create a plot of body mass (x) by bill length (y)
- Render it!
- Chunk 1: load
Inline code
The mtcars dataset has 32 rows
The mtcars dataset has an average miles/per gallon of 20.090625
The mtcars dataset has an average miles/per gallon of 20.1
Inline code with Jupyter
Pure Python/Julia Quarto documents via engine: jupyter can also do inline code, but this requires the use of IPython.display.Markdown or the Markdown package for Julia
Our turn
- Open
materials/workshop/03-authoring/inline-code.qmd - Look through the source code, and then render it
- Check out the appearance and building up of inline code -> inline output
- Try to add your own new calculations for inline reporting
Code chunks options
All code chunk options at yihui.org/knitr/options/
If you’ve used RMarkdown before, you’re likely used to:
                mpg cyl  disp  hp drat    wt  qsec vs am gear carb
Fiat 128       32.4   4  78.7  66 4.08 2.200 19.47  1  1    4    1
Honda Civic    30.4   4  75.7  52 4.93 1.615 18.52  1  1    4    2
Toyota Corolla 33.9   4  71.1  65 4.22 1.835 19.90  1  1    4    1
Fiat X1-9      27.3   4  79.0  66 4.08 1.935 18.90  1  1    4    1
Porsche 914-2  26.0   4 120.3  91 4.43 2.140 16.70  0  1    5    2
Lotus Europa   30.4   4  95.1 113 3.77 1.513 16.90  1  1    5    2
Quarto introduces the “hash pipe” in #|
                mpg cyl  disp  hp drat    wt  qsec vs am gear carb
Fiat 128       32.4   4  78.7  66 4.08 2.200 19.47  1  1    4    1
Honda Civic    30.4   4  75.7  52 4.93 1.615 18.52  1  1    4    2
Toyota Corolla 33.9   4  71.1  65 4.22 1.835 19.90  1  1    4    1
Fiat X1-9      27.3   4  79.0  66 4.08 1.935 18.90  1  1    4    1
Porsche 914-2  26.0   4 120.3  91 4.43 2.140 16.70  0  1    5    2
Lotus Europa   30.4   4  95.1 113 3.77 1.513 16.90  1  1    5    2
Quarto’s hash pipe #|

Quarto chunk options
```{r}
#| warning: false
#| fig-cap: "Air Quality"
#| fig-alt: "A ggplot2 with temperature by ozone levels along with a trend line indicating the increase in temperature with increasing ozone levels."

library(ggplot2)
ggplot(airquality, aes(Ozone, Temp)) +
        geom_point() +
        geom_smooth(method = "loess", se = FALSE)
```
Air Quality
RMarkdown vs Quarto
You can mix and match or use only R Markdown or Quarto style knitr options. However, note the difference between ‘naming’ of the chunk options, typically one.two vs one-two. The one.two exists for backwards compatibility and you should focus on one-two syntax.
fig.align vs fig-align
fig.dpi vs fig-dpi
This syntax is preferred because it aligns with Pandoc, which uses word1-word2 style
Quarto chunk options
Note
Note that if you prefer it is still possible to include chunk options on the first line (e.g. ```{r, echo = FALSE}). That said, we recommend using the comment-based syntax to make documents more portable and consistent across execution engines as that syntax only works for backwards compatability with R/RMarkdown.
Chunk options included this way use YAML syntax rather than R syntax for consistency with options provided in YAML front matter. You can still however use R code for option values by prefacing them with !expr. For example:
#| fig-cap: !expr paste("Air", "Quality")Setup Chunk
A special chunk! There can ONLY be one chunk named setup. It typically is used to set up the default values for the entire document with knitr::opts_chunk$set() and loading global R packages.
knitr::opts_chunk defaults
List of 27
 $ eval         : logi TRUE
 $ echo         : logi TRUE
 $ results      : chr "markup"
 $ tidy         : logi FALSE
 $ tidy.opts    : NULL
 $ collapse     : logi FALSE
 $ prompt       : logi FALSE
 $ comment      : logi NA
 $ highlight    : logi TRUE
 $ size         : chr "normalsize"
 $ background   : chr "#F7F7F7"
 $ strip.white  : 'AsIs' logi TRUE
 $ cache        : logi FALSE
 $ cache.path   : chr "03-computation-editors_cache/revealjs/"
 $ cache.vars   : NULL
 $ cache.lazy   : logi TRUE
 $ dependson    : NULL
 $ autodep      : logi FALSE
 $ cache.rebuild: logi FALSE
 $ fig.keep     : chr "high"
 $ fig.show     : chr "asis"
 $ fig.align    : chr "default"
 $ fig.path     : chr "03-computation-editors_files/figure-revealjs/"
 $ dev          : chr "png"
 $ dev.args     : NULL
 $ dpi          : int 96
$ fig.ext : NULLList of 26
$ fig.width : int 10
$ fig.height: int 5
$ fig.env : chr "figure"
$ fig.cap : NULL
$ fig.scap : NULL
$ fig.lp : chr "fig:"
$ fig.subcap: NULL
$ fig.pos : chr ""
$ out.width : NULL
$ out.height: NULL
$ out.extra : NULL
$ fig.retina: num 2
$ external : logi TRUE
$ sanitize : logi FALSE
$ interval : num 1
$ aniopts : chr "controls,loop"
$ warning : logi FALSE
$ error : logi FALSE
$ message : logi FALSE
$ render : NULL
$ ref.label : NULL
$ child : NULL
$ engine : chr "R"
$ split : logi FALSE
$ include : logi TRUE
$ purl : logi TRUECode chunks are controllable
Some examples
| Option | Description |
|---|---|
fig-height: 4 |
Plots generated from this chunk will have a height of 4 inches. |
fig-width: 6 |
Plots generated from this chunk will have a width of 6 inches. |
dpi: 150 |
Plots generated will have a dots per inch (pixel density) of 150 |
echo: false |
Code will not be echoed (ie not shown) |
eval: false |
Nothing will be evaluated, but code still be printed |
cache: true |
Results will be cached, and chunk will not be run in subsequent renders, unless code is changed. |
message: false |
No messages will be printed |
warning: false |
No warnings will be printed |
include: false |
No ouputs/echo/messages/etc will be returned |
There’s a lot of options!
Chunks can be named
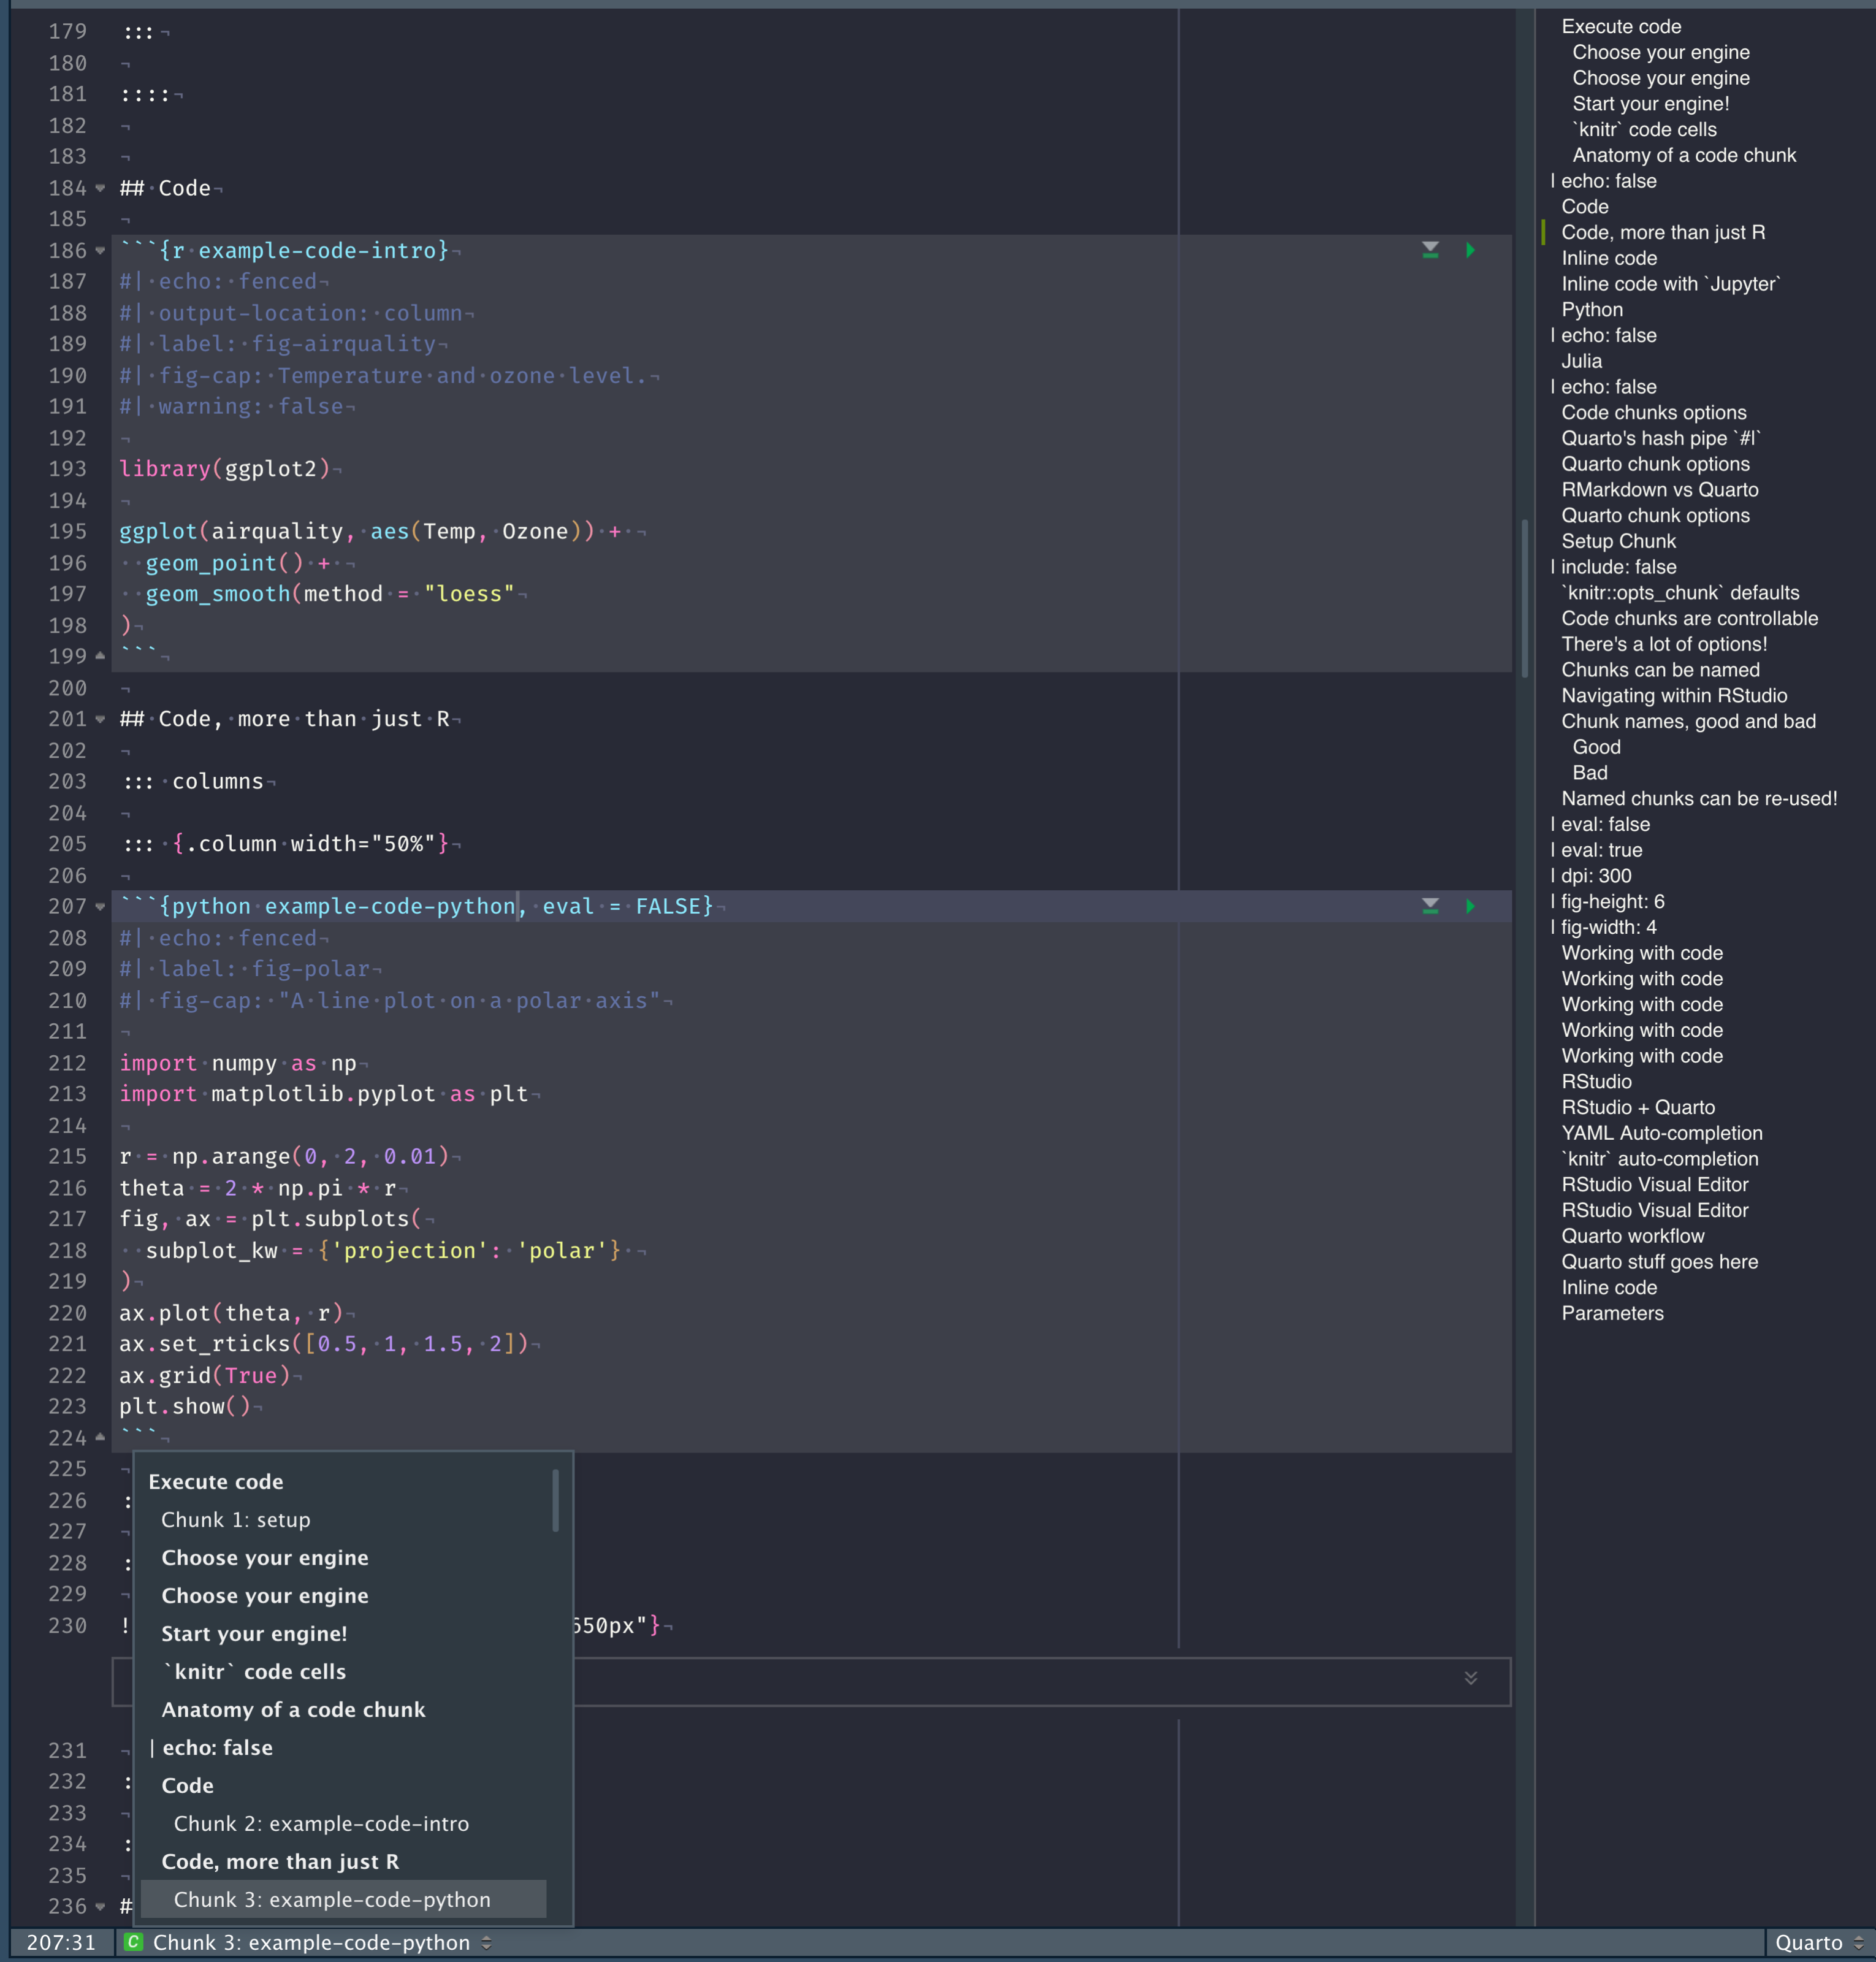
- Useful for troubleshooting (ie where is the document failing on render)
label: unnamed-chunk-23
  |..............................|  83%
  ordinary text without R code
  |..............................|  85%
label: unnamed-chunk-24 (with options)
List of 2
 $ fig.dim: num [1:2] 6 4
 $ dpi    : num 150
  |..............................|  86%
  ordinary text without R code
Our Turn
- Open RStudio and
materials/workshop/broken-notebook - Try to render it, see the errors
- Fix the errors by finding their named chunks and then render again!
Chunk names, good and bad
Good
chunkmyChunkmy-chunkmychunk1
Bad
(These will fail)
my_chunkmy chunk
Working with code
                mpg cyl  disp  hp drat    wt  qsec vs am gear carb
Fiat 128       32.4   4  78.7  66 4.08 2.200 19.47  1  1    4    1
Honda Civic    30.4   4  75.7  52 4.93 1.615 18.52  1  1    4    2
Toyota Corolla 33.9   4  71.1  65 4.22 1.835 19.90  1  1    4    1
Fiat X1-9      27.3   4  79.0  66 4.08 1.935 18.90  1  1    4    1
Porsche 914-2  26.0   4 120.3  91 4.43 2.140 16.70  0  1    5    2
Lotus Europa   30.4   4  95.1 113 3.77 1.513 16.90  1  1    5    2
Working with code
Working with code
                mpg cyl  disp  hp drat    wt  qsec vs am gear carb
Fiat 128       32.4   4  78.7  66 4.08 2.200 19.47  1  1    4    1
Honda Civic    30.4   4  75.7  52 4.93 1.615 18.52  1  1    4    2
Toyota Corolla 33.9   4  71.1  65 4.22 1.835 19.90  1  1    4    1
Fiat X1-9      27.3   4  79.0  66 4.08 1.935 18.90  1  1    4    1
Porsche 914-2  26.0   4 120.3  91 4.43 2.140 16.70  0  1    5    2
Lotus Europa 30.4 4 95.1 113 3.77 1.513 16.90 1 1 5 2Editors
RStudio, quick intro
- Use R Projects, i.e. a
.RProj - Overview of panes
- Overview of R Console vs Terminal
- Overview of Quarto, output inline vs output to pane
Navigating in the terminal
Because Quarto is a command line interface (CLI), there are times you’ll need to use it via the terminal. A great overview of using the command line and navigating files/directories is available via the Data Carpentries or a great interactive tool for understanding commands: https://tldr.ostera.io
| Command | Action |
|---|---|
pwd |
Print name of current working directory |
cd |
Change current working directory |
ls |
List directory contents |
quarto --help |
Return quarto help docs |
mkdir howdy |
Make a new folder/directory called “howdy” |
rm howdy/some-file.qmd | Remove |
a file called some-file.qmd from the “howdy” folder |
RStudio
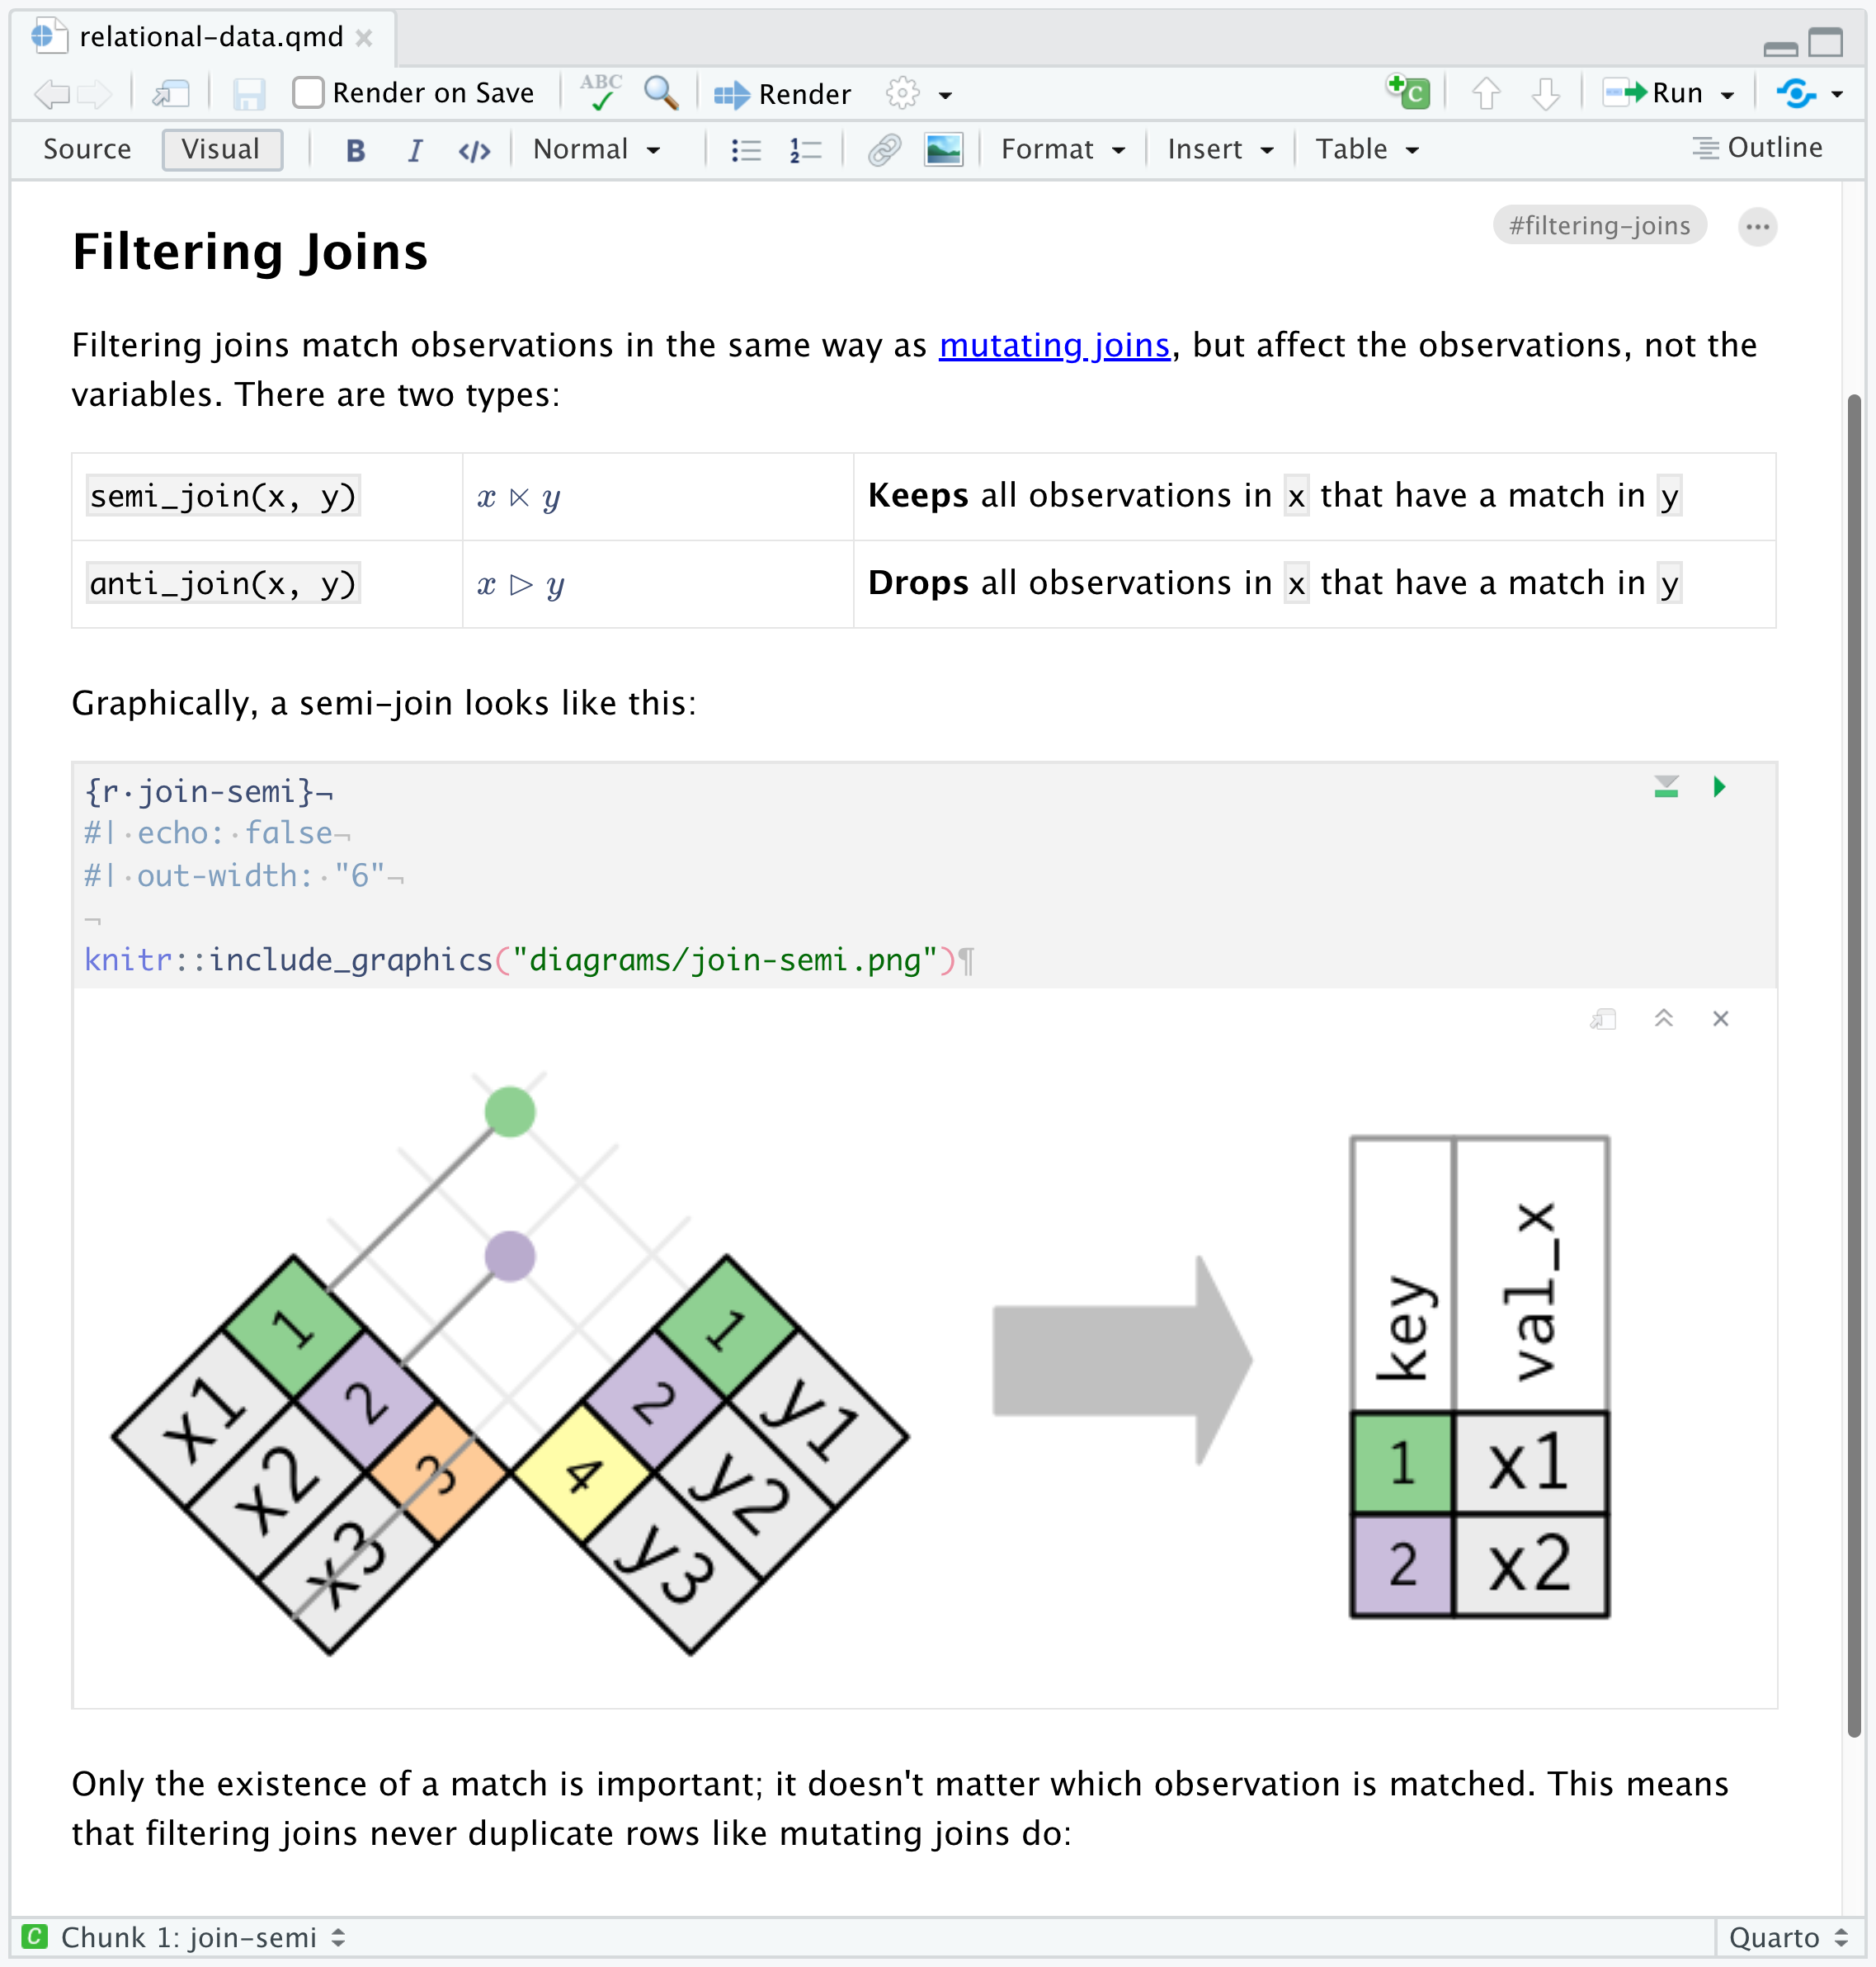
RStudio has deep integration with R, knitr and Quarto
- Render button
- Visual Editor
- Preview of output
You should always be using a recent release of the RStudio IDE - especially for the Quarto features.
RStudio 2022.07.1 and beyond comes bundled with a production-stable release of Quarto, no additional install needed!
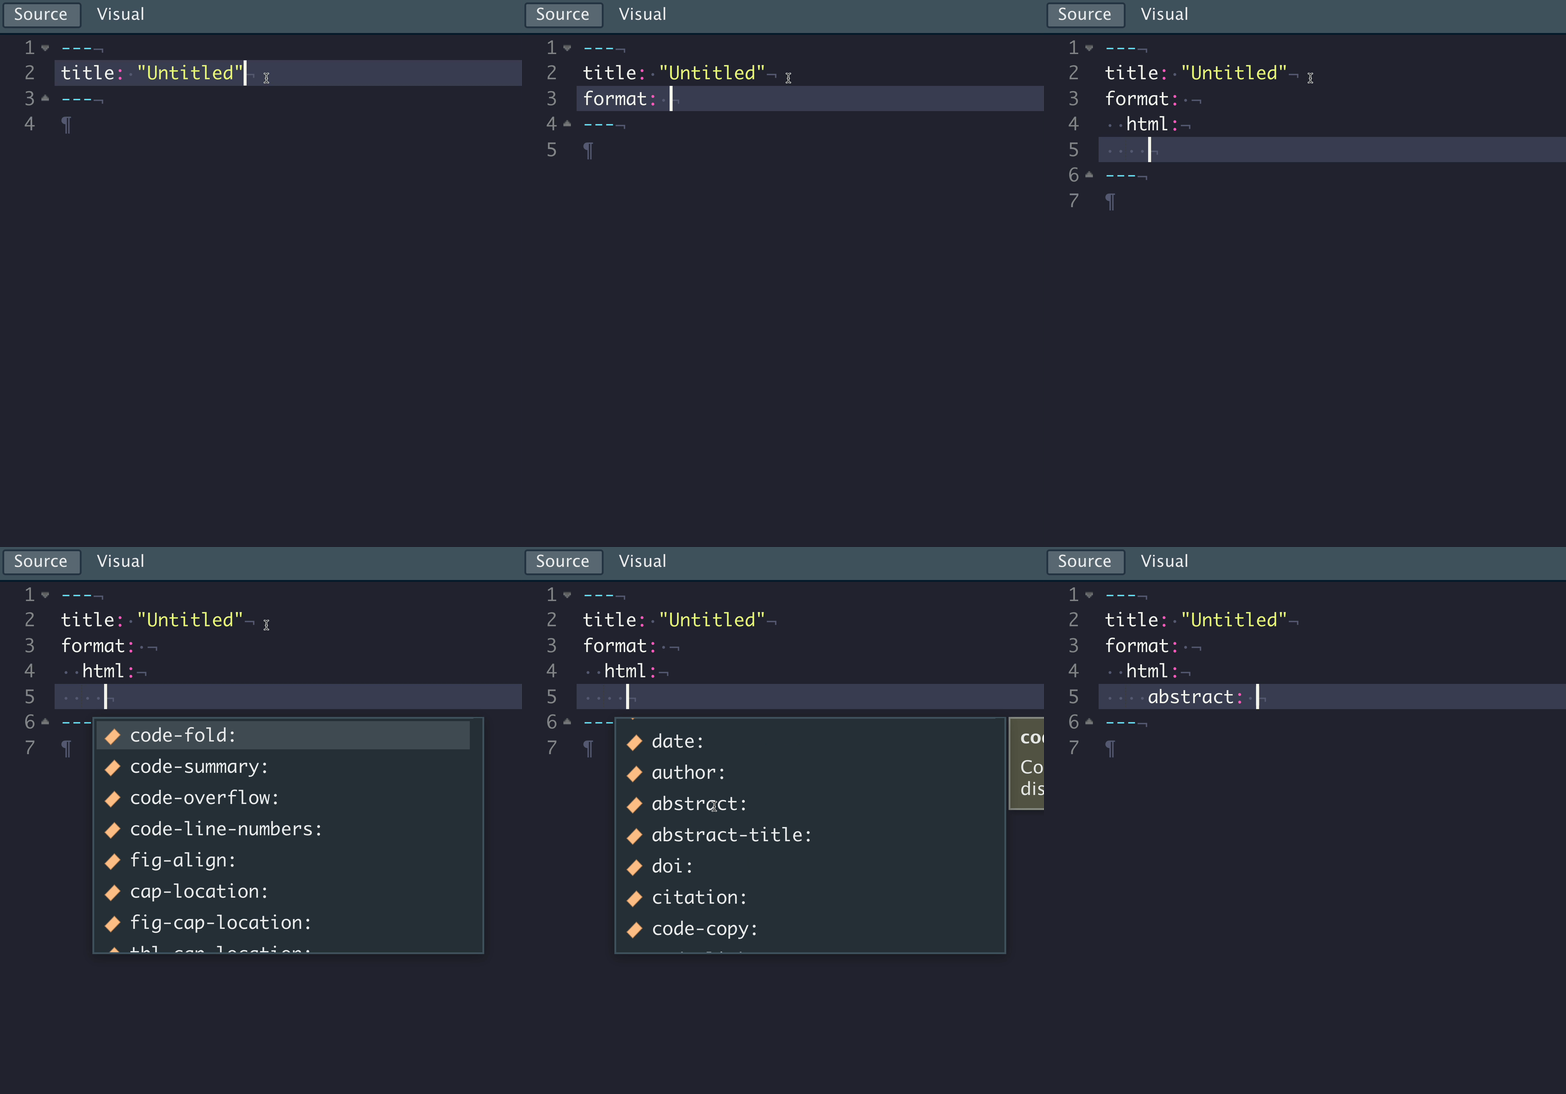
YAML Auto-completion
Quarto + RStudio provides a rich YAML auto-completion based on text.
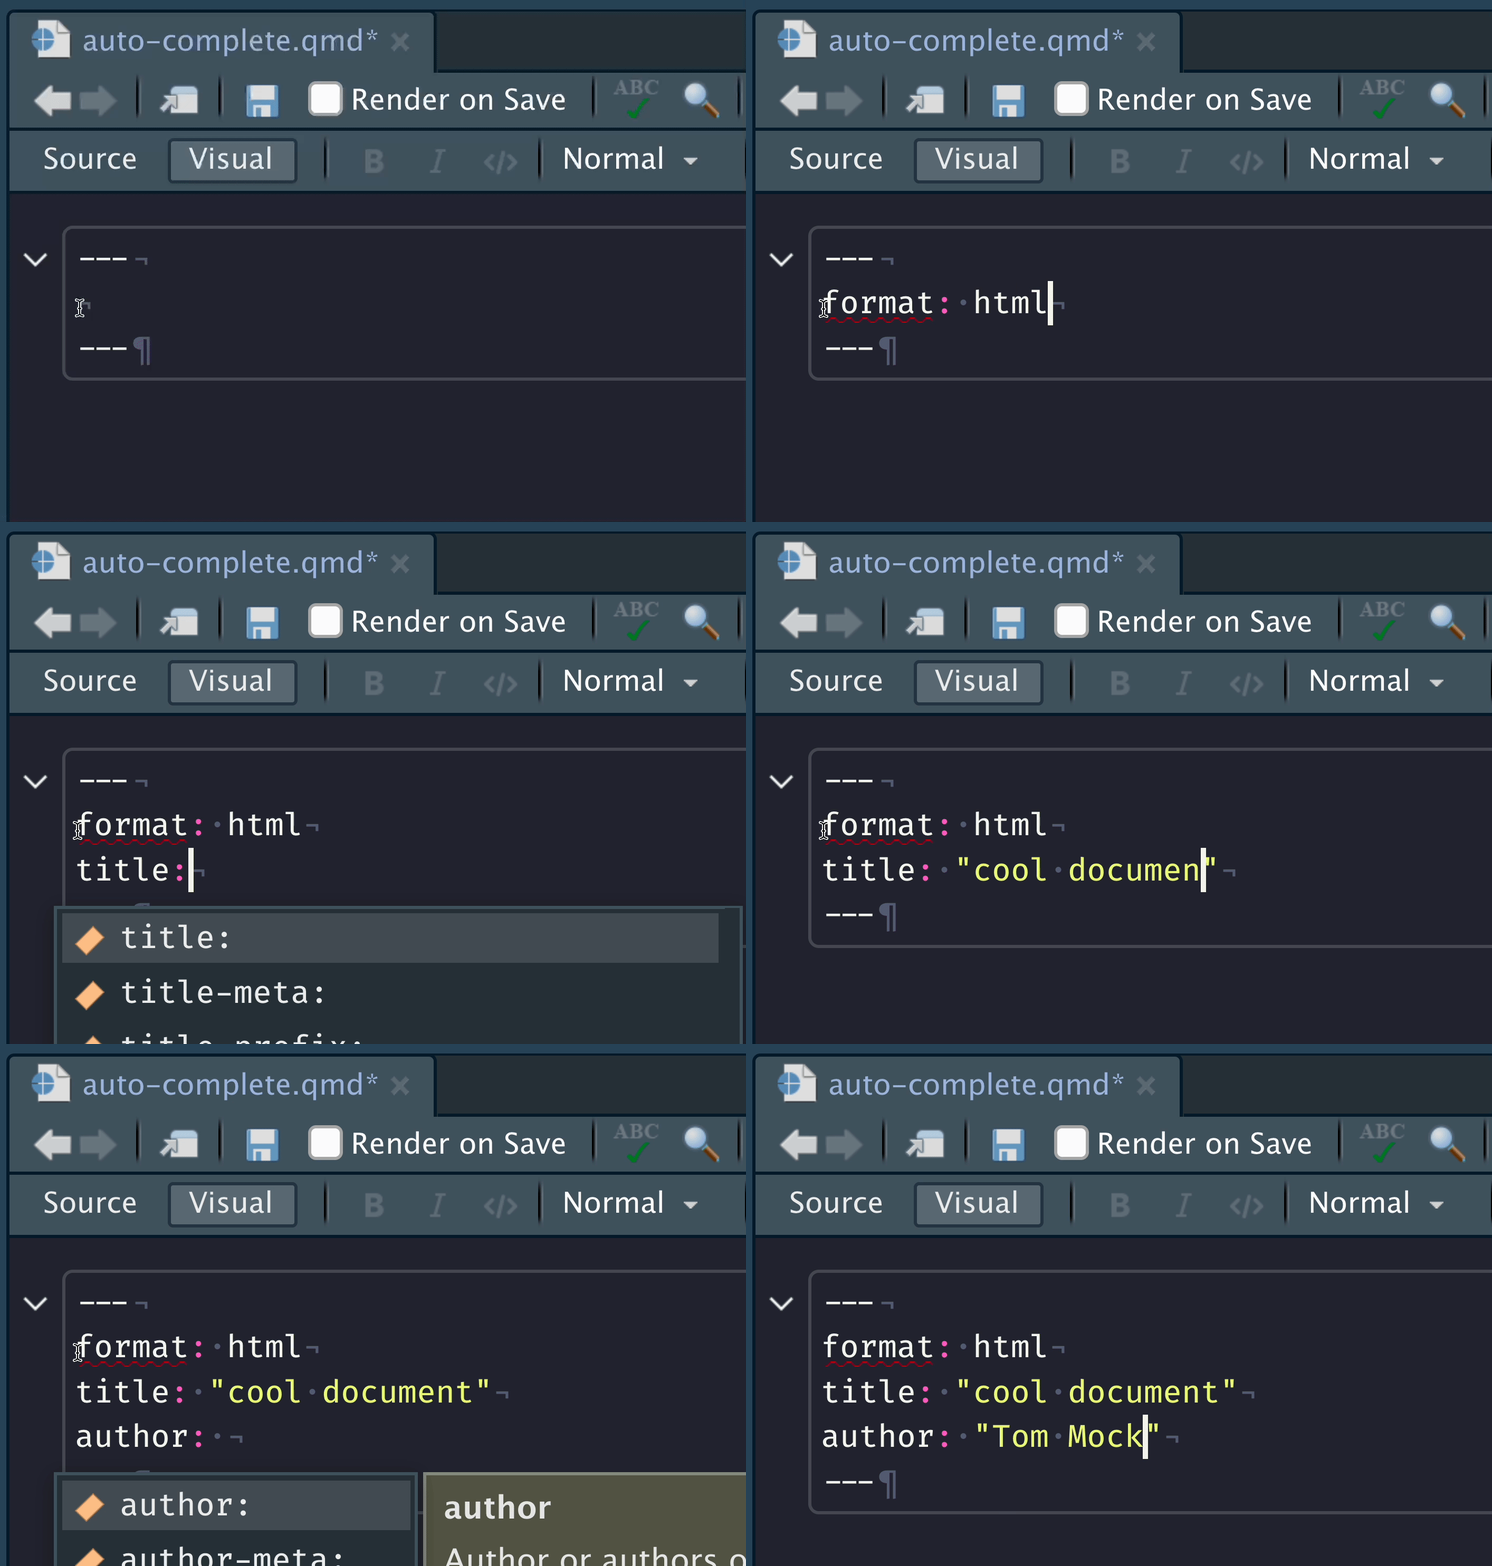 ## YAML Auto-completion
To find all the available options for a YAML section, you can use Ctrl + Space
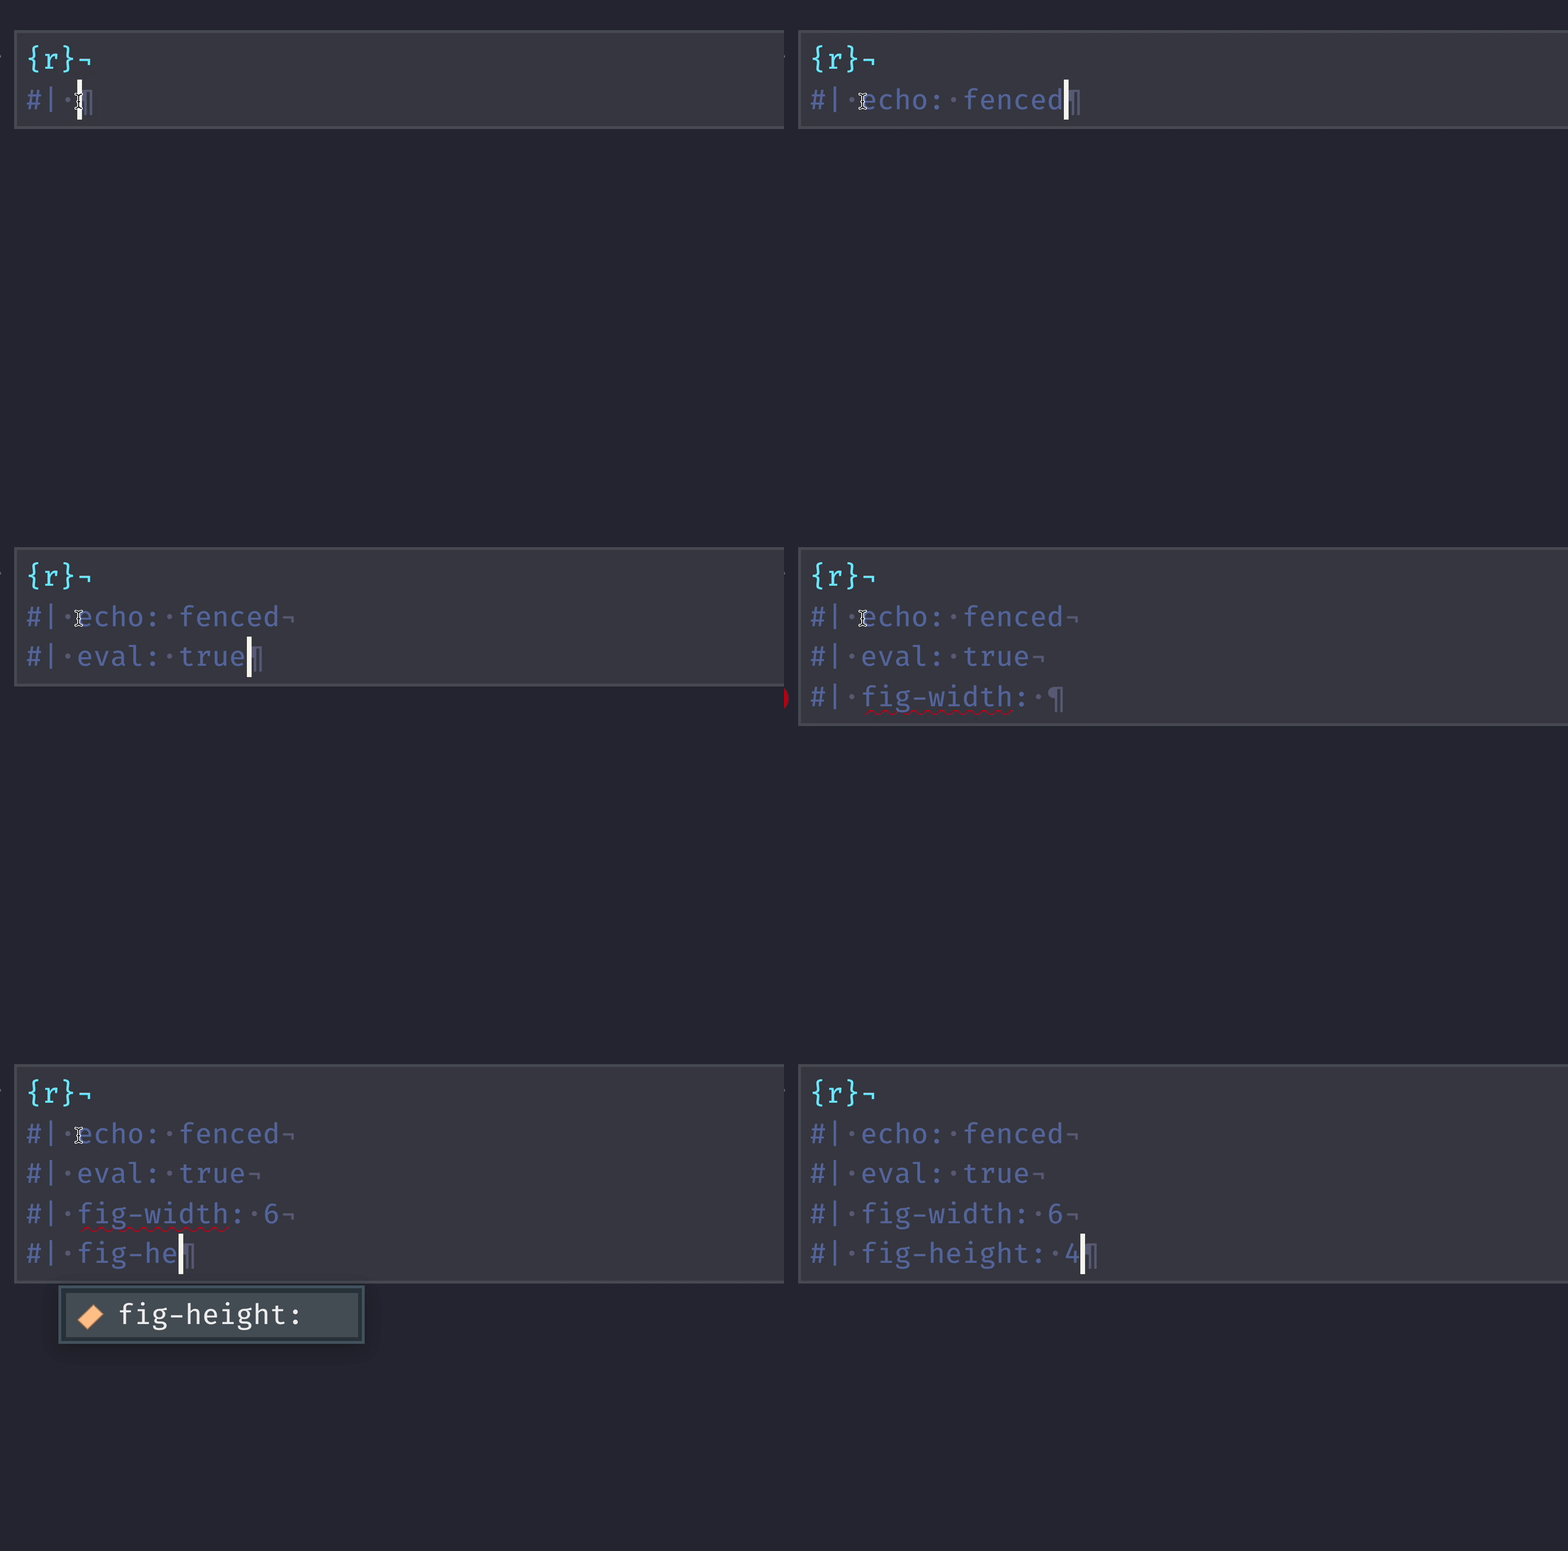
knitr auto-completion
You can use tab-completion inside knitr chunk options for RMarkdown style or Quarto style as well.
RStudio Visual Editor
Our turn
- Open
materials/workshop/03-authoring/visual-editor.qmd - Explore the UI elements and visual editor mode
- Turn Visual Editor mode on/off and explore the sections
- Render the document and compare the viewer to Visual Mode!
VS Code
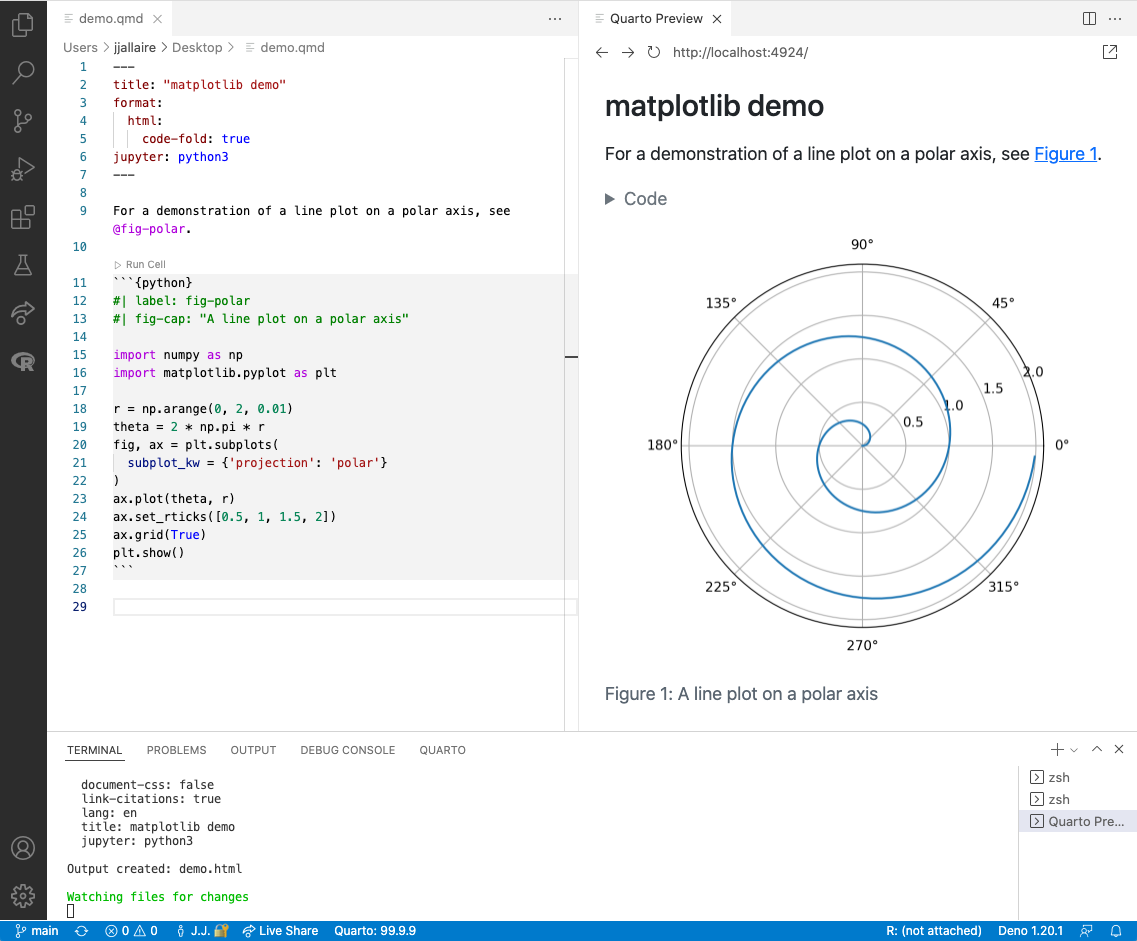
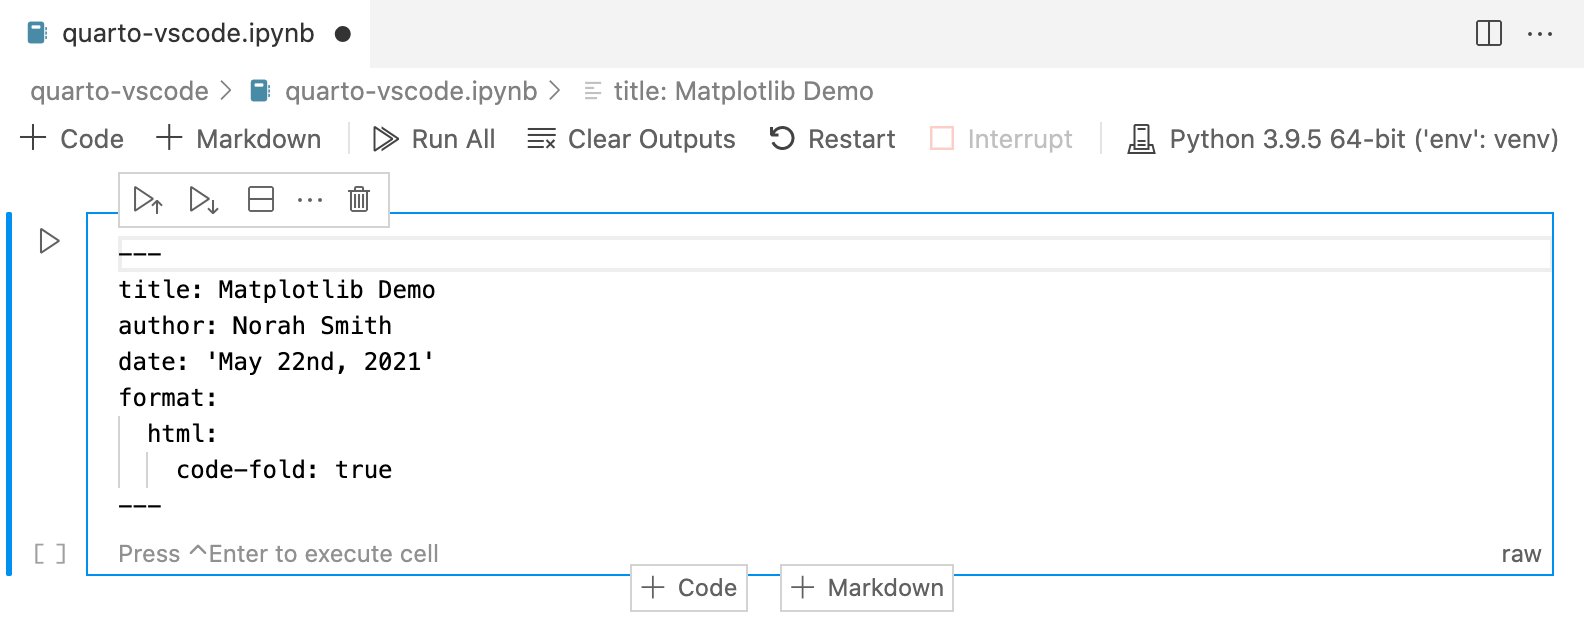
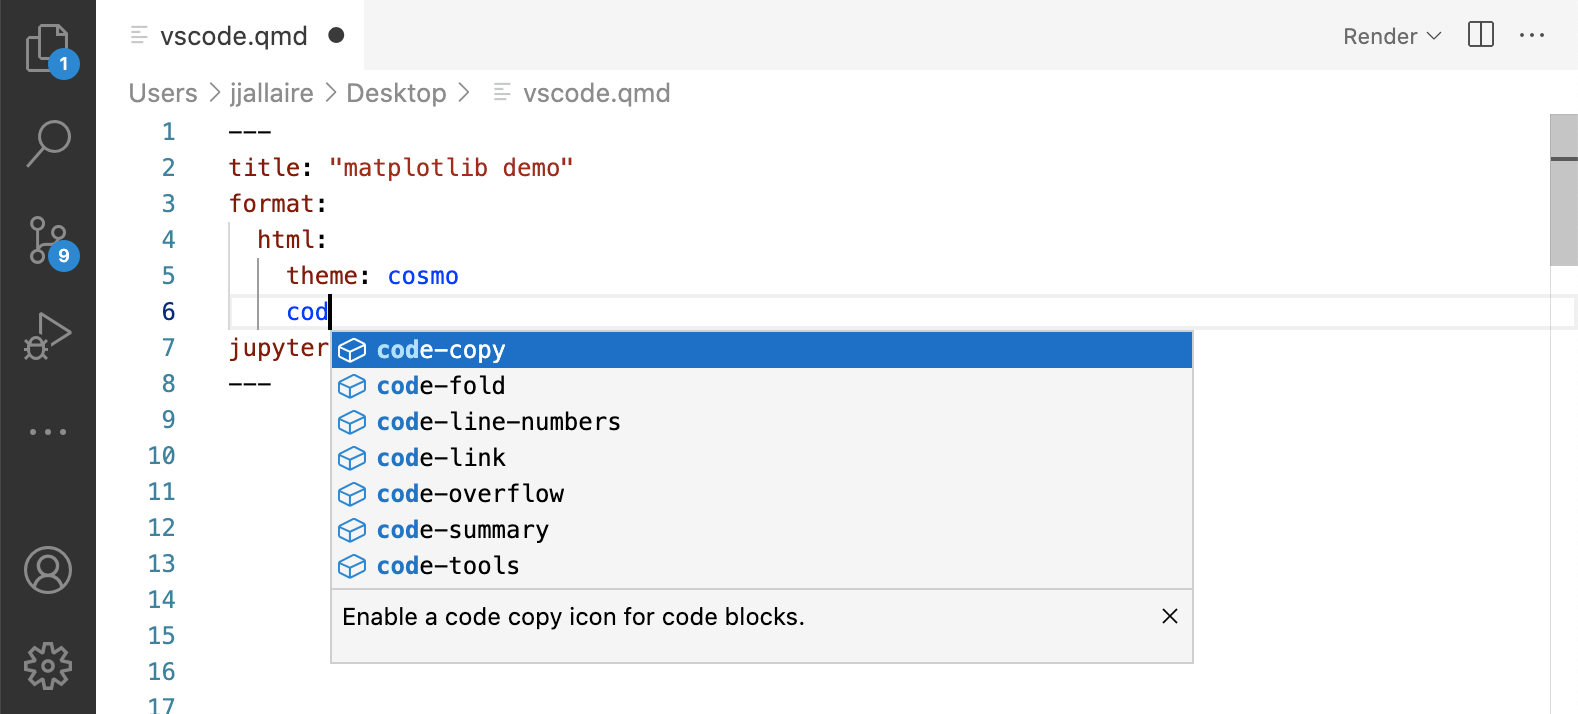
VS Code YAML
VS Code, YAML Intelligence
Jupyter/Jupyter Lab
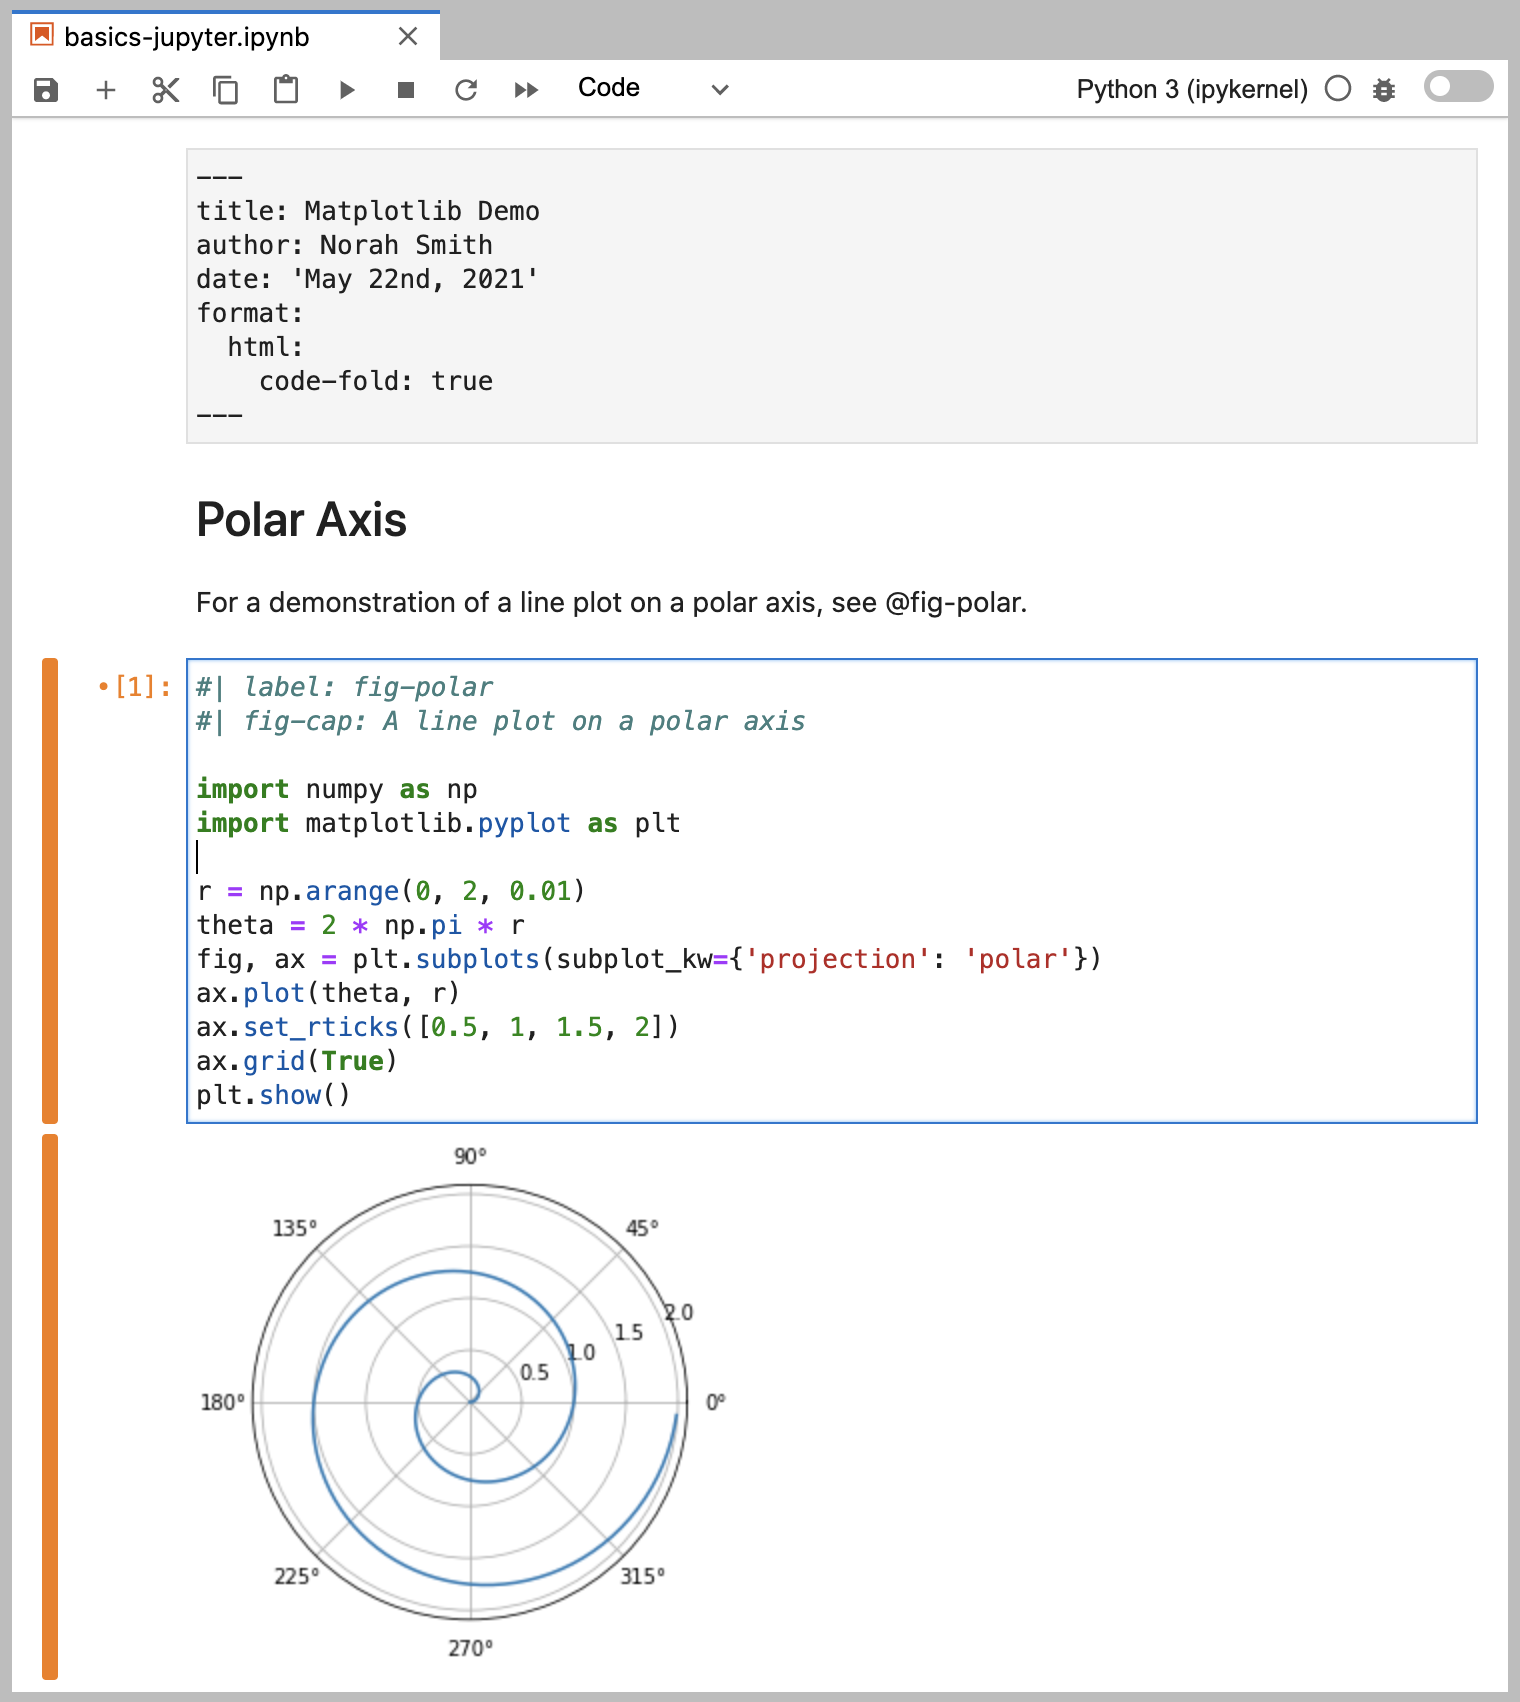
Jupyter
quarto preview notebook.ipynb --to html
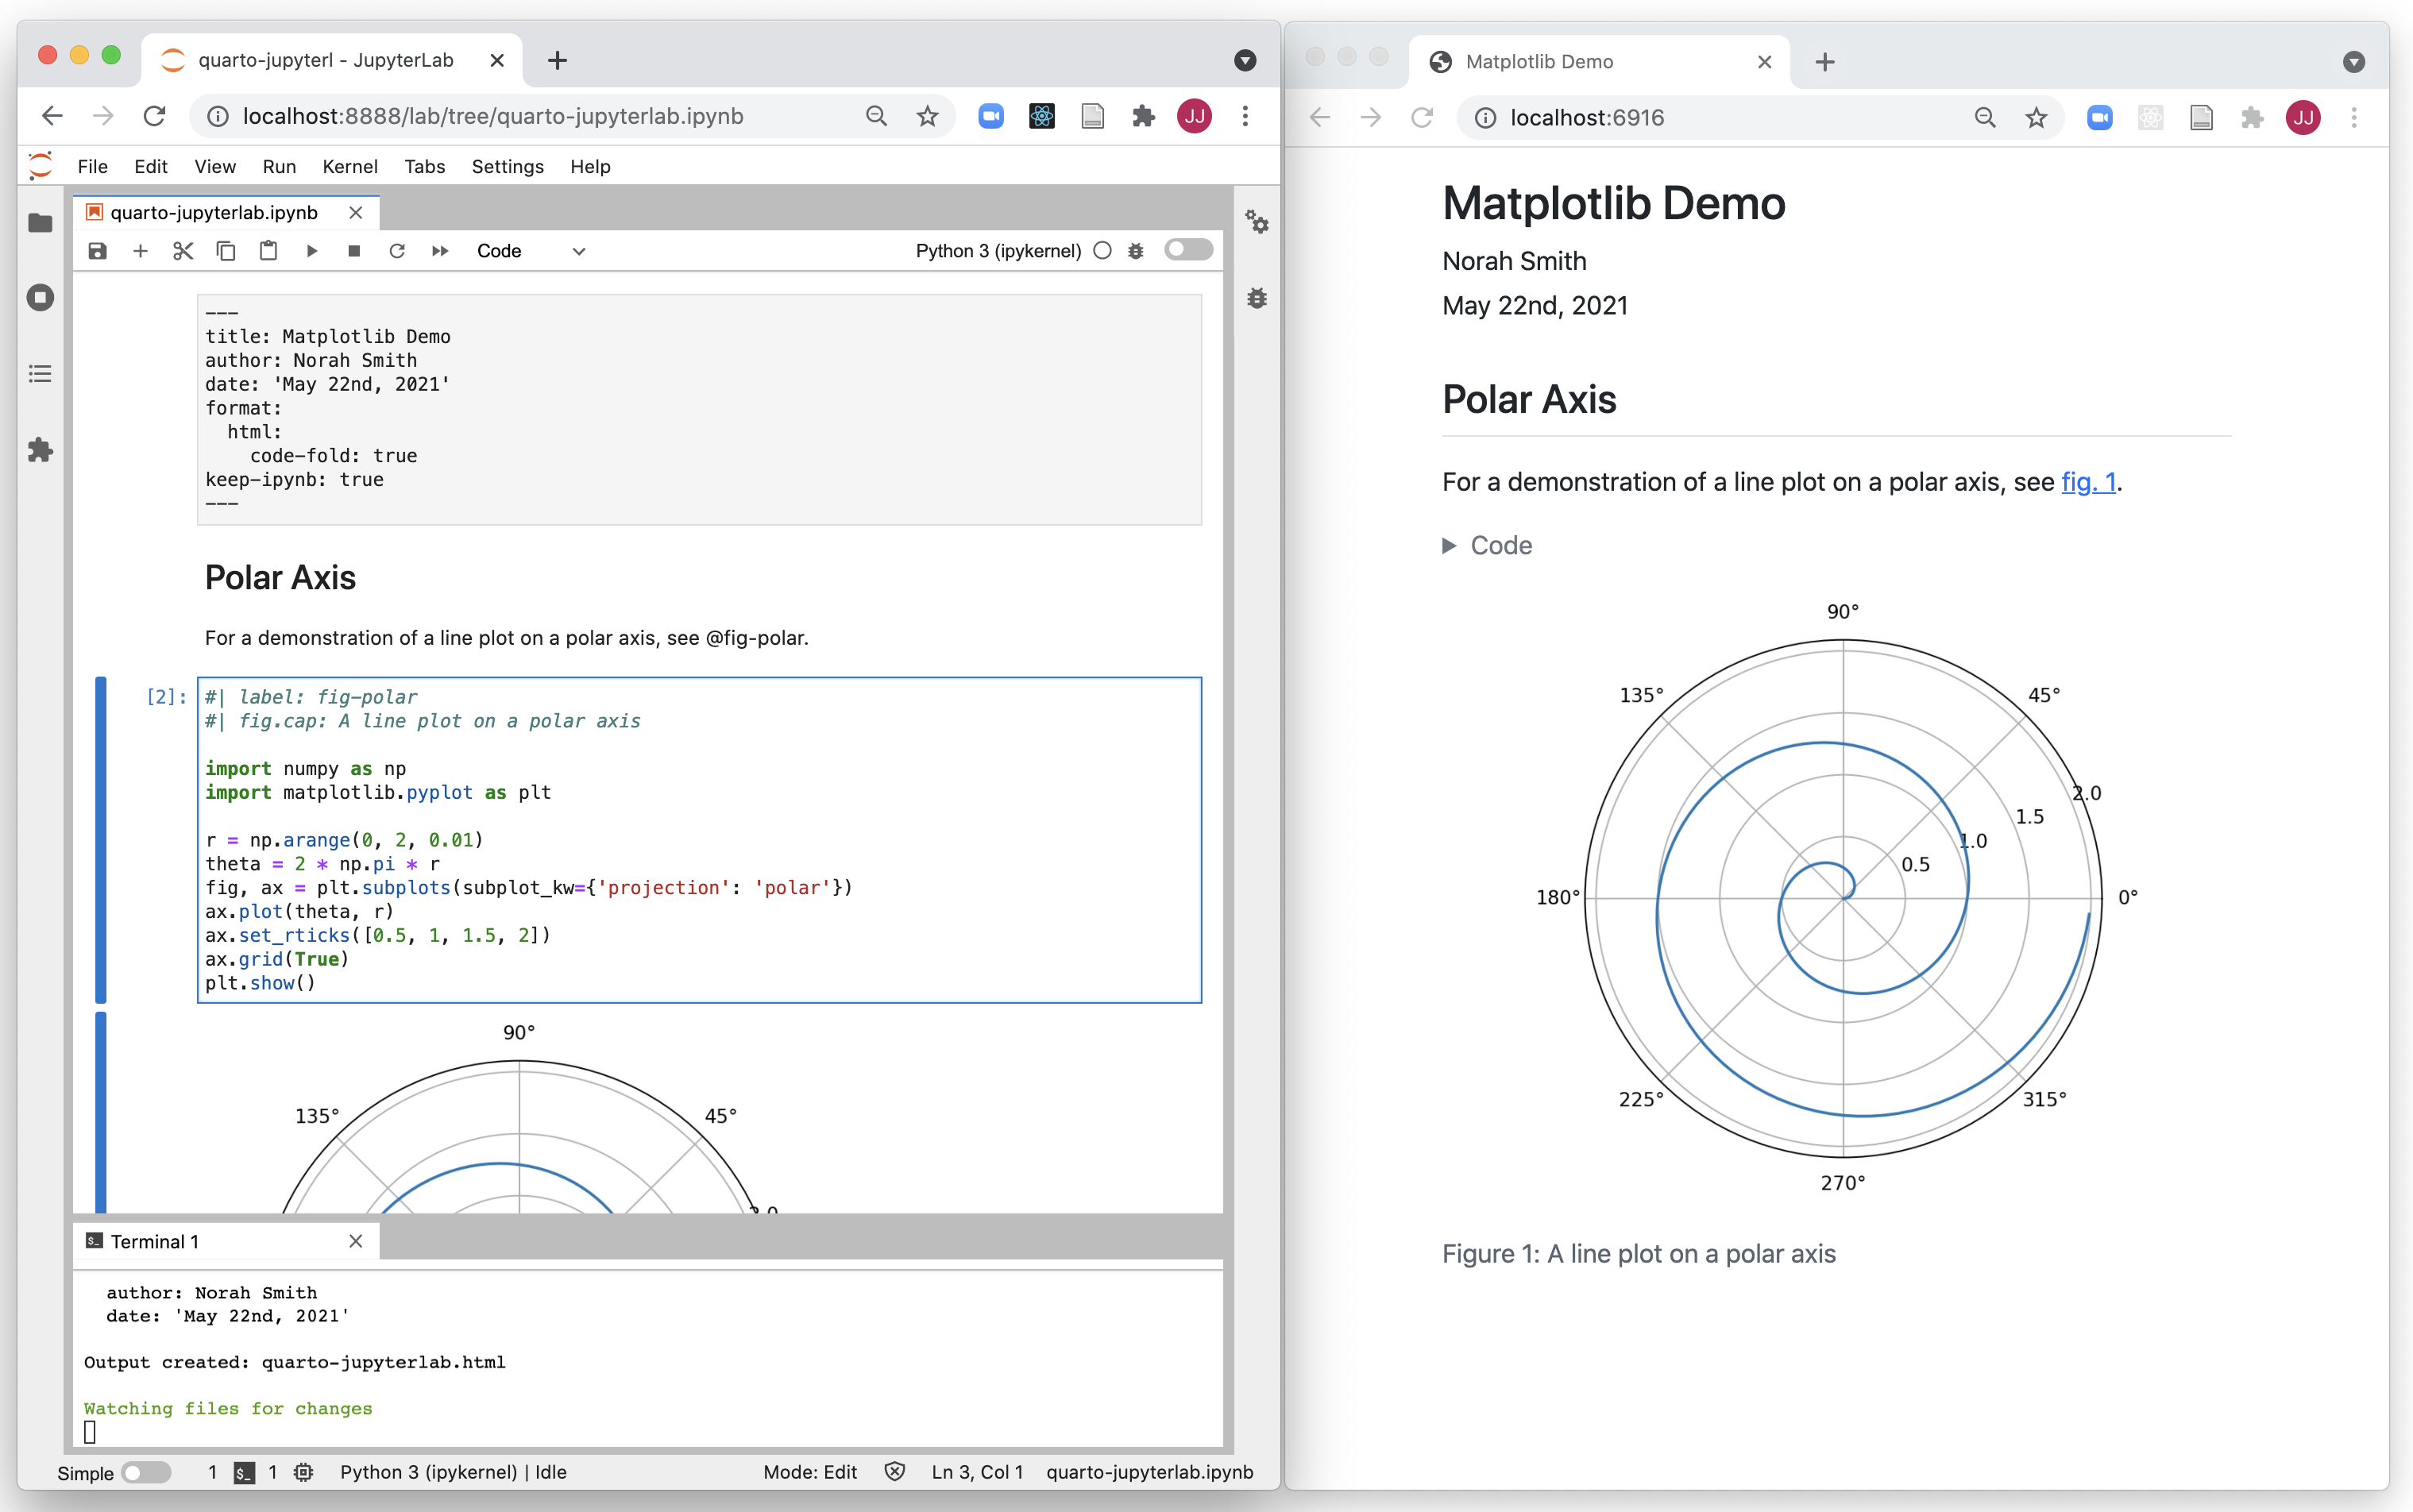
Jupyter YAML
Treat YAML as a “raw cell” in Jupyter - Jupyter doesn’t care about YAML, but it’s needed/used by Quarto


